| Low | Estimated | High |
|---|---|---|
| $308,406 | $311,999 | $620,588 |
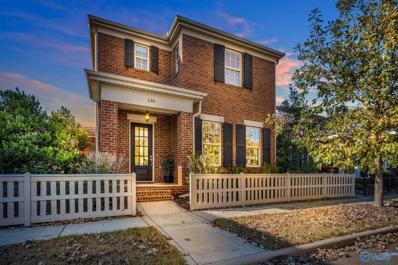
Analysis: Your home of interest was recently on the market (2017-05-31) and had a price adjustment of 6%. Its size of 2,098 Sqft is in the lower 50 percentile of selected comparables. Its last asking price of $316,750, at $151 Sqft, is in the lower 50 percentile of our selected sold homes of similar location and size.
Disclaimer: This automated home valuation is not as accurate, as the comparative market techniques deployed by professionals like appraisers, brokers, and agents. It is only a price range estimate based on recent sales statistics. We strongly recommend that you obtain a free professional home valuation prior to making a purchase-offer or listing your home for sale.
Often a good comparable sale to consider, when valuing a home for a listing or offer price, is a recent sale of a similar home on the same street. This home did have 28 same street sales within our database, the most recent occuring in 2024.
| Low | Average | High | |
|---|---|---|---|
| Price | $355,000 | $446,516 | $558,525 |
| Price Sqft | $155 | $222 | $297 |
| Size Sqft | 1,525 | 2,040 | 2,443 |
| On Market | 1 Days | 239 Days | 724 Days |

With 93 recent sales in the neighborhood, the average sales price is $534,497. The following charts highlight the average overall sales activity within the neighborhood over the last three years.
| Low | Average | High | |
|---|---|---|---|
| Price | $329,900 | $534,497 | $1,076,130 |
| Price Sqft | $147 | $221 | $347 |
| Size Sqft | 1,525 | 2,432 | 4,718 |
| On Market | 1 Days | 306 Days | 892 Days |
Exploring recently sold homes nearby is another way to investigate your home value. This sold home map enables you to examine all recently sold homes nearby your selected location.
© 2016 @Homes Realty All Rights Reserved